Introduction
Financial Statement Analysis helps business owners, investors, and managers evaluate a company's performance and financial position. In O-Level POA, students are expected to calculate key ratios, interpret the results, and explain changes in business performance.
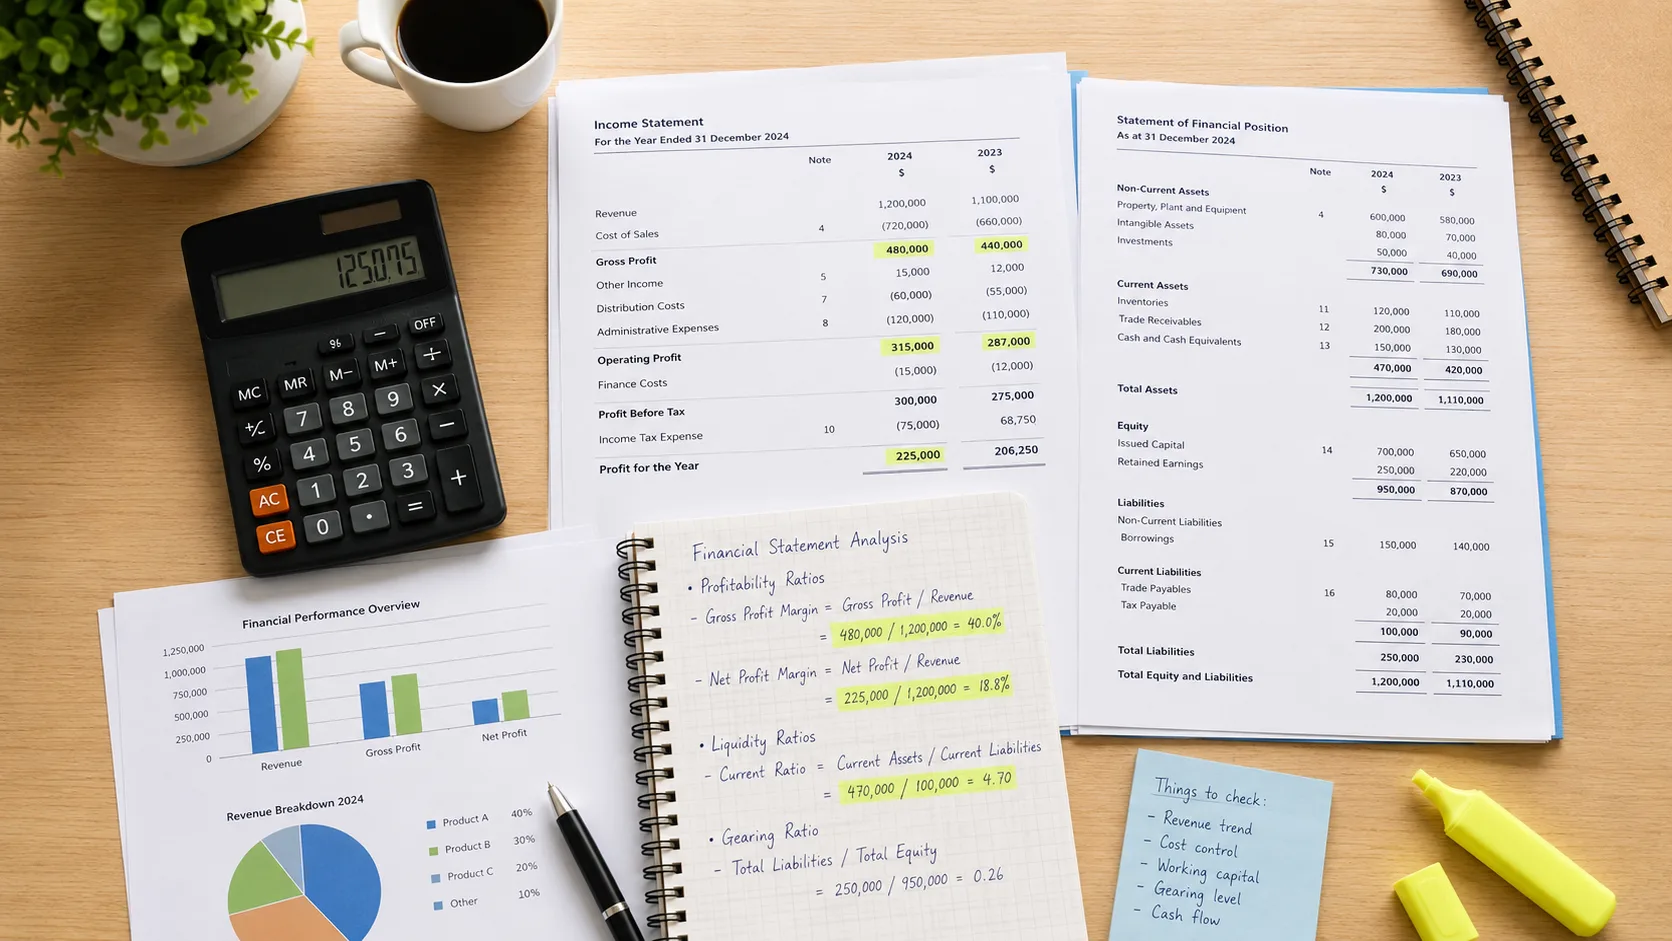
Gross Profit Margin
Gross Profit Margin measures how much of every dollar of revenue is kept as gross profit after deducting the cost of goods sold.
Formula — Gross Profit Margin
Gross Profit Margin = Gross Profit ÷ Revenue × 100%
Example:
- Revenue: $80,000 | Cost of Goods Sold: $48,000 | Gross Profit: $32,000
- Gross Profit Margin = $32,000 ÷ $80,000 × 100% = 40%
Net Profit Margin
Net Profit Margin measures how much of every dollar of revenue is kept as net profit after all expenses (including operating expenses) are deducted.
Formula — Net Profit Margin
Net Profit Margin = Profit for the Year ÷ Revenue × 100%
Example:
- Revenue: $80,000 | Profit for the Year: $12,000
- Net Profit Margin = $12,000 ÷ $80,000 × 100% = 15%
Trade Receivables Collection Period
This ratio measures how quickly the business collects money from customers who bought on credit. A shorter collection period means the business collects cash faster.
Formula — Trade Receivables Collection Period
Trade Receivables Collection Period = Trade Receivables ÷ Credit Sales × 365 days
Example:
- Trade Receivables: $9,000 | Credit Sales: $72,000
- Collection Period = $9,000 ÷ $72,000 × 365 = 45.6 days
Inventory Turnover
Inventory Turnover measures how many times the business sells and replaces its entire inventory stock during the accounting period. A higher turnover generally indicates efficient inventory management.
Formula — Inventory Turnover (Times)
Inventory Turnover = Cost of Goods Sold ÷ Average Inventory
Average Inventory = (Opening Inventory + Closing Inventory) ÷ 2
Formula — Inventory Turnover (Days)
Inventory Turnover (Days) = Average Inventory ÷ Cost of Goods Sold × 365 days
Example:
- Opening Inventory: $6,000 | Closing Inventory: $8,000
- Cost of Goods Sold: $56,000
- Average Inventory = ($6,000 + $8,000) ÷ 2 = $7,000
- Inventory Turnover = $56,000 ÷ $7,000 = 8 times
- Inventory Turnover (Days) = $7,000 ÷ $56,000 × 365 = 45.6 days
Comparing Ratios Over Time
One ratio in isolation provides limited information. Examination questions often ask you to compare two years or two businesses and explain the change.
Common causes of ratio changes:
- Gross profit margin decreases — higher cost of goods sold, lower selling prices, increased returns, more discounts given
- Net profit margin decreases — higher operating expenses, increased wages, higher rent
- Collection period increases — more lenient credit terms offered, difficulties collecting from customers
- Inventory turnover slows — less demand, overstocking, obsolete stock
Common Mistakes
- Using the wrong formula — memorise each formula precisely; the examiner will not give marks for using net profit in the gross profit margin formula.
- Forgetting to multiply by 100 for percentages — gross profit margin and net profit margin must be expressed as percentages.
- Not using average inventory — inventory turnover requires average inventory, not closing inventory alone.
- Only calculating, not interpreting — many marks are awarded for interpretation, not just the number. Always explain what the ratio means for the business.
- Stating "more is better" without explanation — always explain why a higher or lower ratio is beneficial in the context of the question.
Practice Questions
- A business has revenue of $120,000, cost of goods sold of $72,000, and operating expenses of $30,000. Calculate (a) gross profit margin and (b) net profit margin.
- Trade receivables are $15,000 and credit sales are $90,000. Calculate the trade receivables collection period in days.
- Opening inventory is $10,000 and closing inventory is $14,000. Cost of goods sold is $96,000. Calculate inventory turnover in times and in days.
- The gross profit margin fell from 45% to 38% this year. Suggest two possible reasons for this change.
- The trade receivables collection period increased from 30 days to 52 days. Is this a favourable or unfavourable change? Explain.
For students who want structured support on financial statement analysis and other O-Level POA topics, Strong-Willed Tutoring Services offers focused POA tuition in Singapore. View our O-Level POA tuition programme, explore the POA crash course, or check our tuition fees.
Conclusion
Financial Statement Analysis is an important topic that develops students' ability to evaluate business performance and make informed recommendations. At Strong-Willed Tutoring Services, we practise ratio calculations and written interpretation together, ensuring students can handle both the calculation and the explanation parts of O-Level examination questions.